
Julianna Carlson-van Kleef | 16/03/2022
A Guide to Lighthouse, PageSpeed Insights and Core Web Vitals
There are many facets to creating a well-performing website – yet page speed influences them all.
How fast a webpage initially loads and how quickly a user can navigate to other areas of the site has a significant impact on a visitor’s experience of the site. A negative user experience can negatively impact conversions and in turn have a costly impact on an SME’s bottom line.
Google recognized the importance of page speed back in April 2010, with its blog post Using site speed in web search ranking:
“Faster sites create happy users and we've seen in our internal studies that when a site responds slowly, visitors spend less time there. But faster sites don't just improve user experience; recent data shows that improving site speed also reduces operating costs. Like us, our users place a lot of value in speed—that's why we've decided to take site speed into account in our search rankings.”
With this short and easy to understand text, Google packed a punch by touching upon many concepts that are now buzzwords today: user experience (UX), bounce rate, return on investment (ROI), page speed, search engine optimization (SEO), and search engine result pages (SERP) to name a few.
But Google also wrote another interesting line immediately after this: “We use a variety of sources to determine the speed of a site relative to other sites.” Now in 2022, Google has many different tools that can be used to assess a website’s performance. The different tools can lead to confusion amongst those who work with websites. What are the different tools? What do these tools measure? When should they be used? And who should use them?
PageSpeed Insights
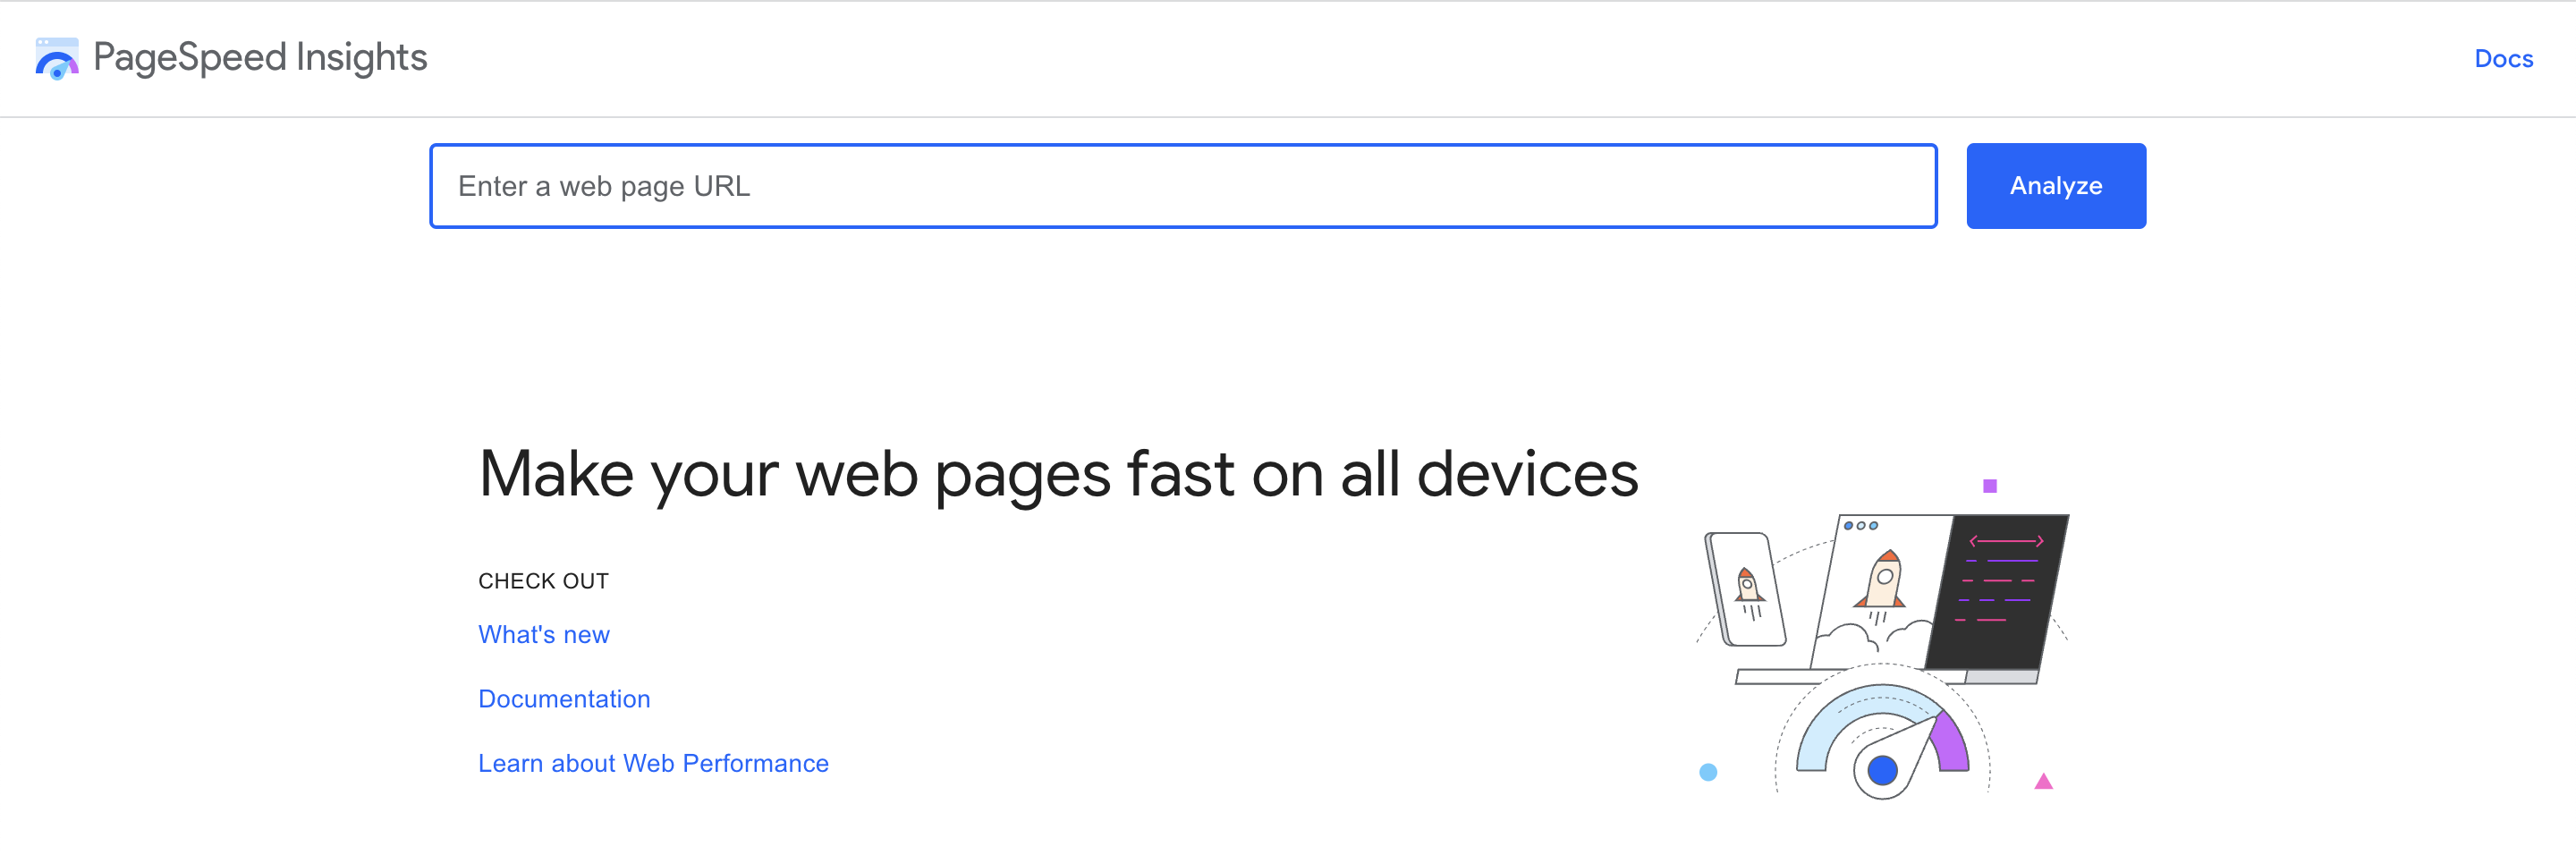
What is PageSpeed Insights (PSI), what is measured, and what is included in the report?
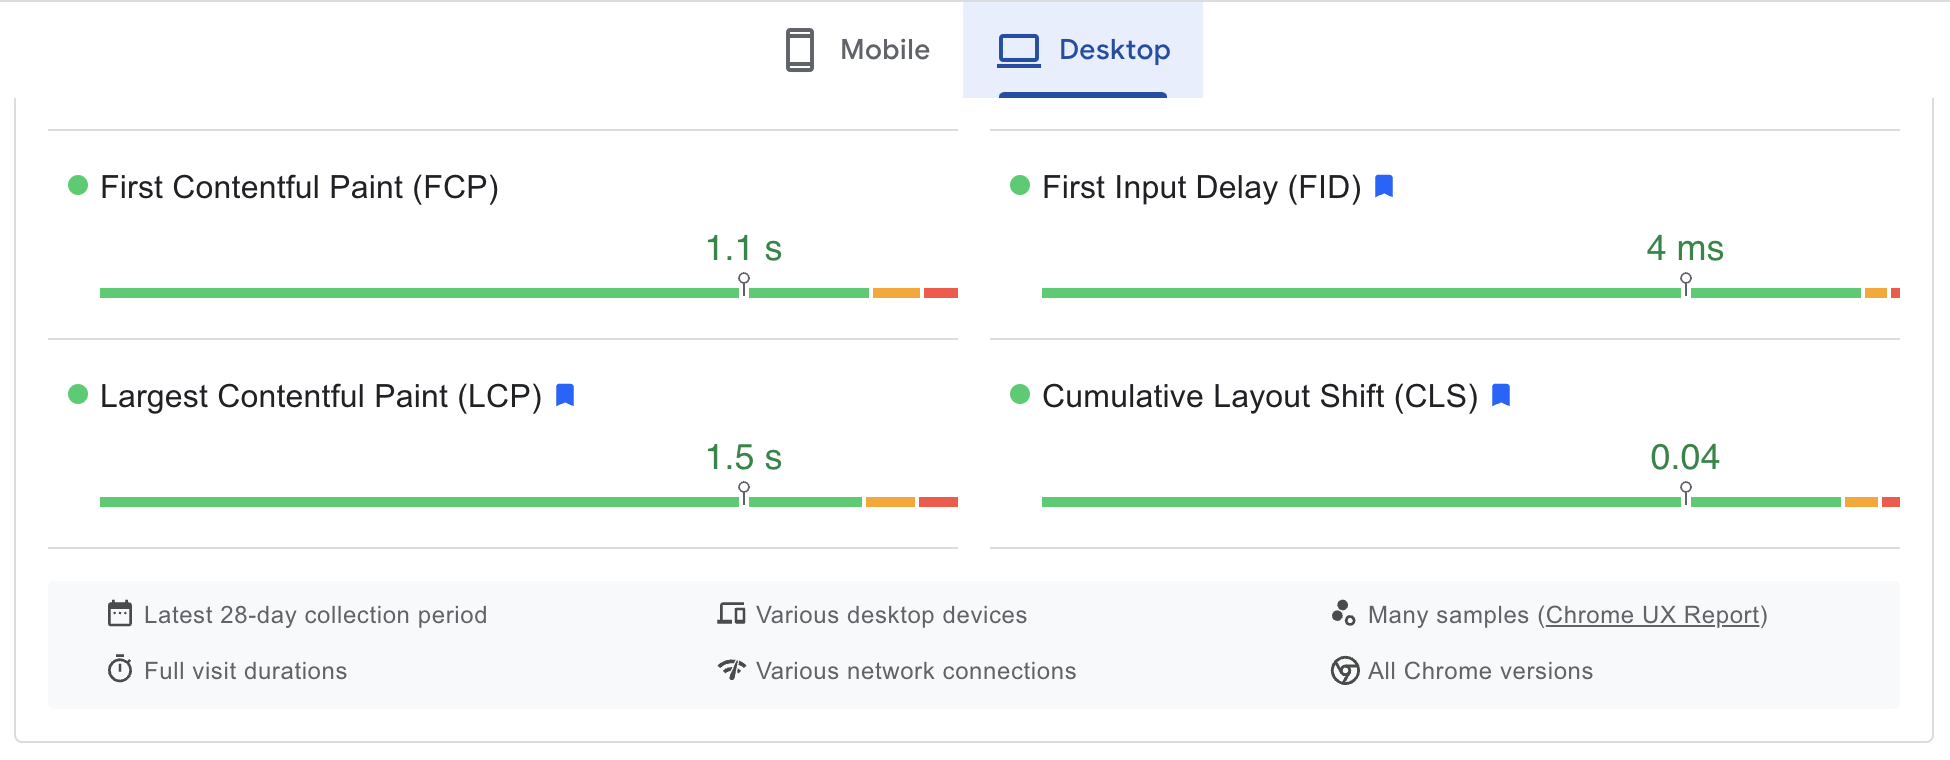
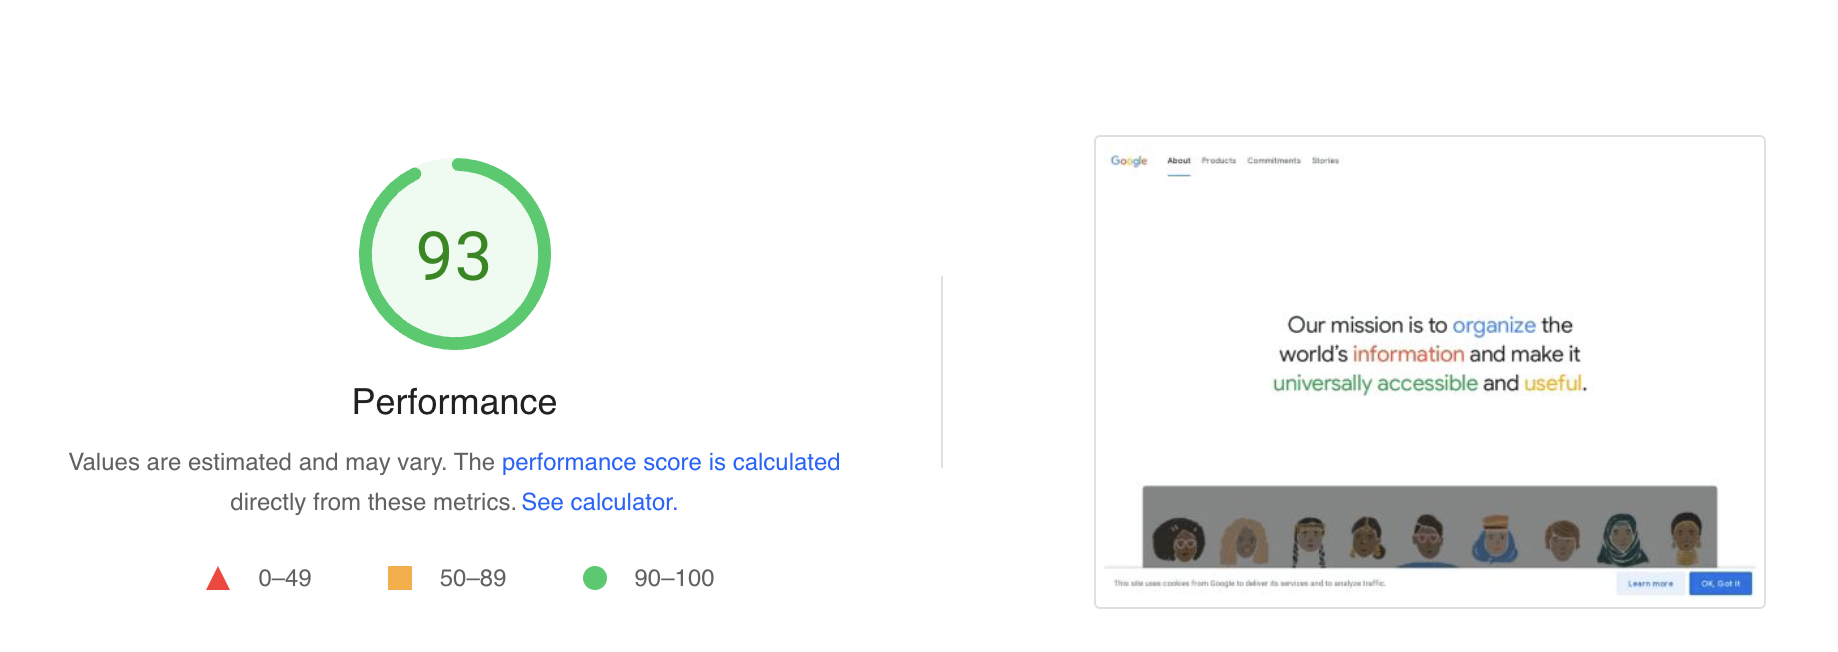
PageSpeed Insights reports on both mobile and desktop page performance as well as provides page improvement suggestions. The PSI report includes information on how the page performs in a controlled environment (lab data) and in a real-world setting (field data), where scores are divided and color-coded, with green indicating good/fast, orange indicating needs improvement/moderate, and red indicating poor/slow. PageSpeed Insights include a performance score, which has been generated from loading the site in a simulated environment, as well as reports on data from real users for the previous 28 days for the following four metrics:
• First Contentful Paint (FCP)
• Largest Contentful Paint (LCP)
• First Input Delay (FID)
• Cumulative Layout Shift (CLS)
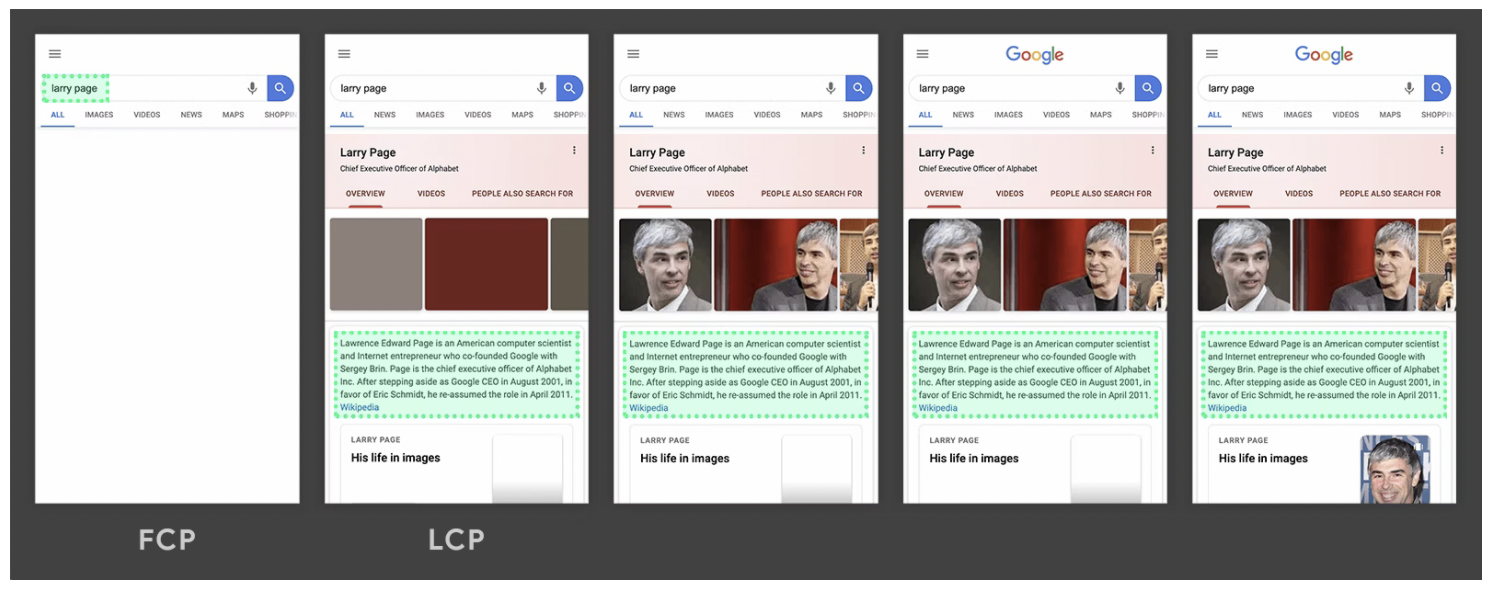
What is First Contentful Paint (FCP)?
As defined by Google: "The First Contentful Paint (FCP) metric measures the time from when the page starts loading to when any part of the page's content is rendered on the screen. For this metric, "content" refers to text, images (including background images), svg elements, or non-white canvas elements." A good FCP score is 1.8 seconds or under, a score that needs improvement is between 1.8 seconds and 3 seconds, and a poor score is anything over 3 seconds.
But let us break down FCP a bit more. Contentful simply means having content. And if you move Paint from the digital world, you could think of FCP as how a canvas is painted, what elements are painted first, and how long it takes.
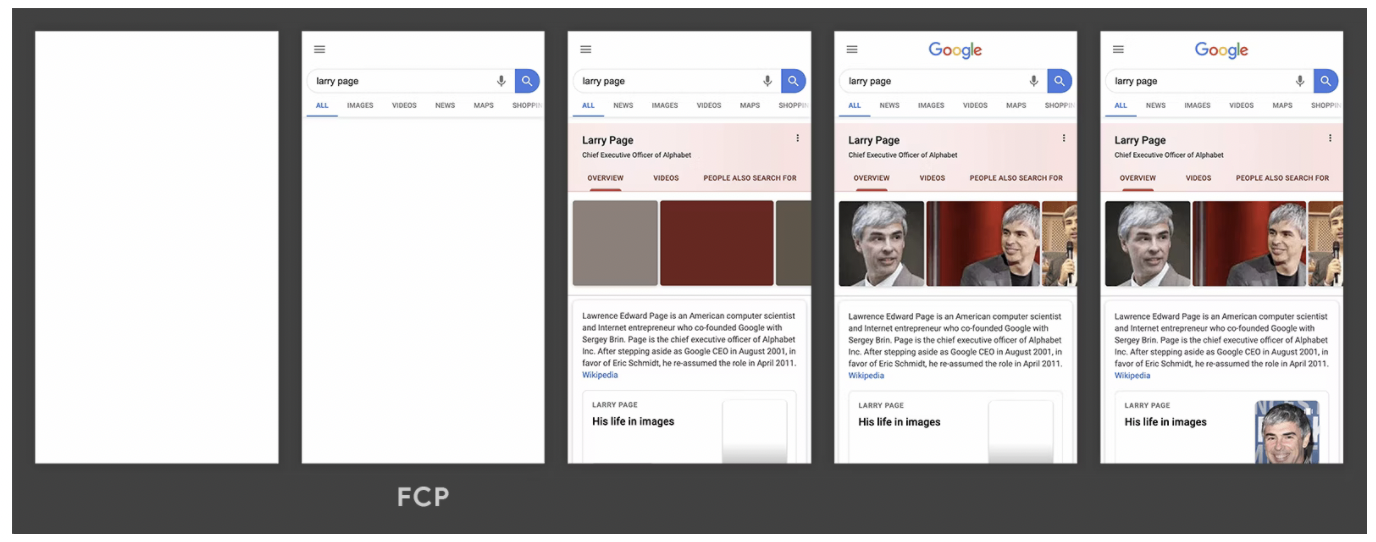
In the photo above, you can see the subject query is the first content displayed and therefore is the FCP. After this comes an overview, then the main images, and finally the additional images. These additional loaded elements brings us then to LCP, or Largest Contentful Paint.
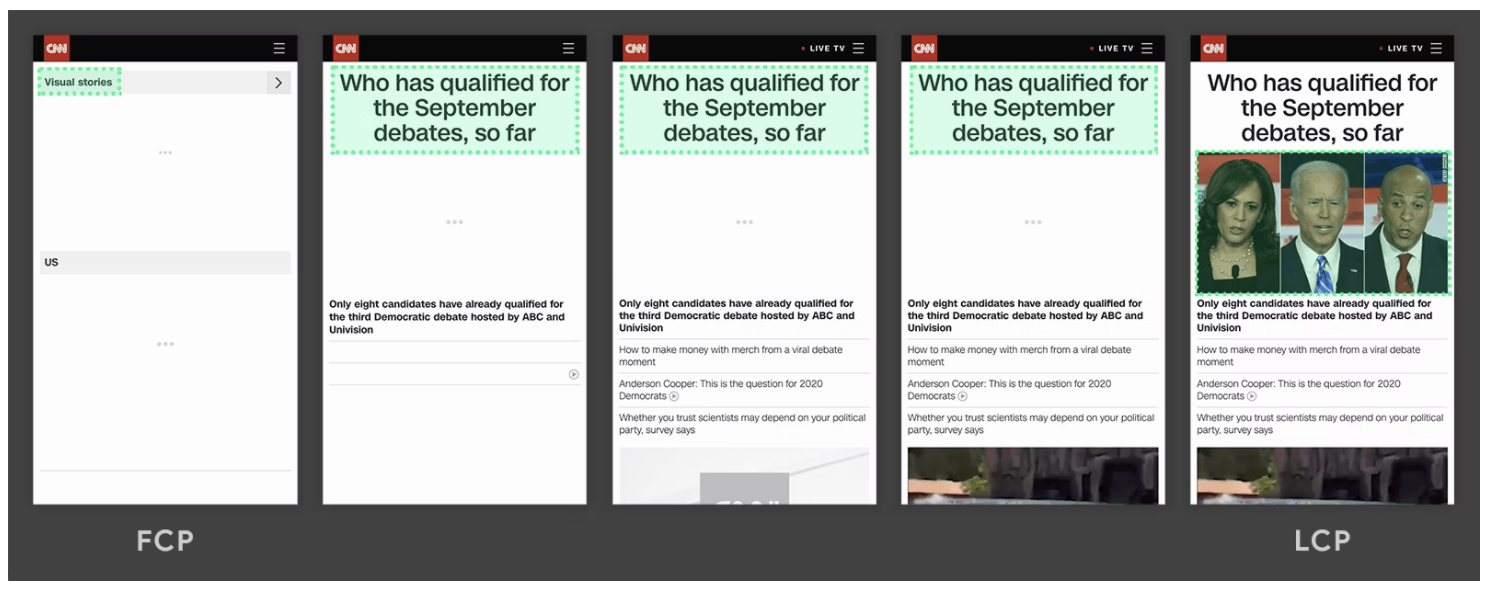
What is Largest Contentful Paint (LCP)?
Defined by Google, “The Largest Contentful Paint (LCP) metric reports the render time of the largest image or text block visible within the viewport, relative to when the page first started loading.” A good LCP score is 2.5 seconds or under, a score that needs improvement is between 2.5 seconds and 4 seconds, and a poor score is anything over 4 seconds.
If we take the painting analogy from before further, you could think of LCP as when the prominent element of a painting has been completed - is this done first with details coming later or waiting to paint the feature element towards the end?
In the photo above, you can see that the text box is the largest element, and in this case, is one of the first elements to load. In the photo below, you can see that the LCP occurs later, as the photo is the largest element and is the last to load.
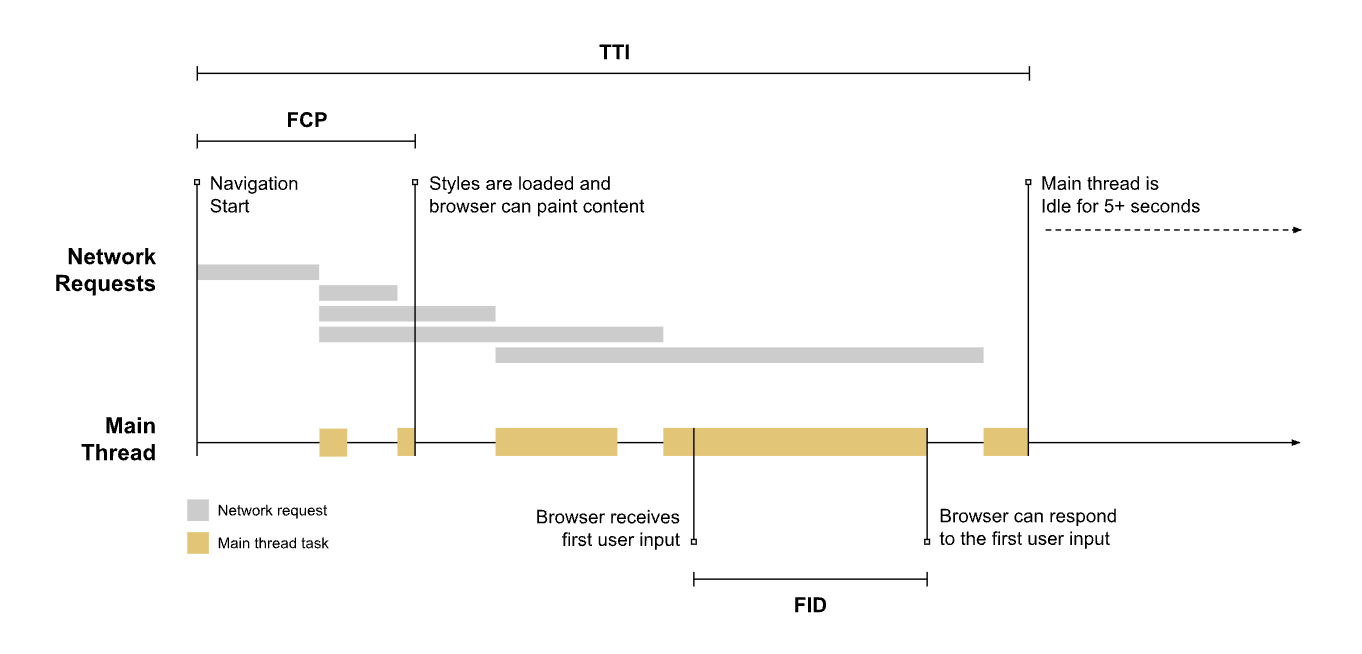
What is First Input Delay (FID)?
As described by Google: "First Input Delay (FID) is an important, user-centric metric for measuring load responsiveness because it quantifies the experience users feel when trying to interact with unresponsive pages—a low FID helps ensure that the page is usable."
But let us break down the new term word by word.
First: This metric is important because it deals with the first impression a visitor has of a website, determined in part by the first user interaction (link click, button tap, etc) with the page, how the website responds, and the first delay experienced.
While persistent delays throughout the site will impact user experience, Google writes, “The biggest interactivity issues we see on the web today occur during page load. Therefore, we believe initially focusing on improving site's first user interaction will have the greatest impact on improving the overall interactivity of the web.”
Input: This is the action of putting something into a process, system, device or computer. This can be clicks, taps, key presses, etc.
Delay: This is the time from the user’s first interaction (click, tap, etc.) to when the browser beings to process and act upon this interaction.
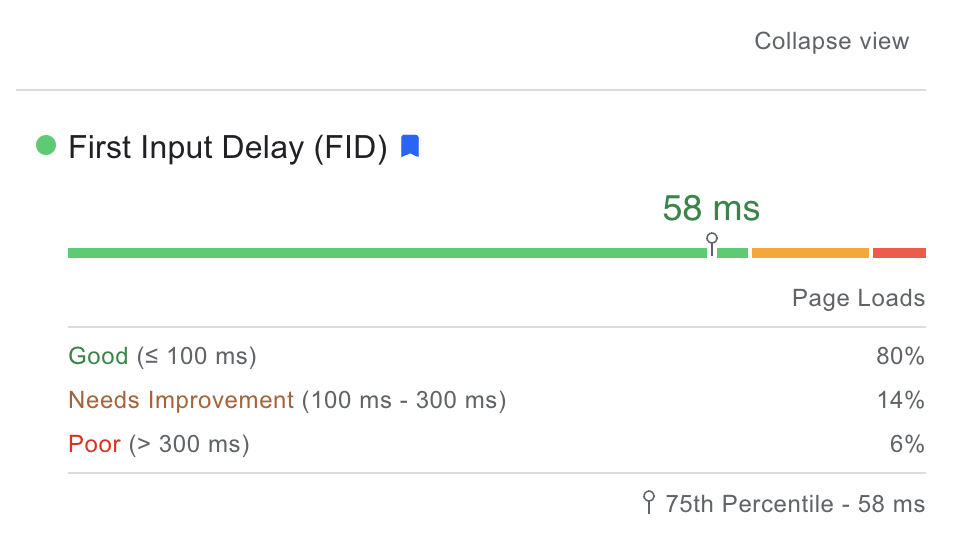
A good FID score is 100 milliseconds (ms) or under, a score that needs improvement is between 100 ms and 300 ms, and a poor score is anything over 300 ms.
It is important to note that the FID metric does not measure the entire processing time, but only the delay between the first user interaction and browser response.
In general, delays occur when the browser is busy with another action, so it cannot respond immediately to the user.
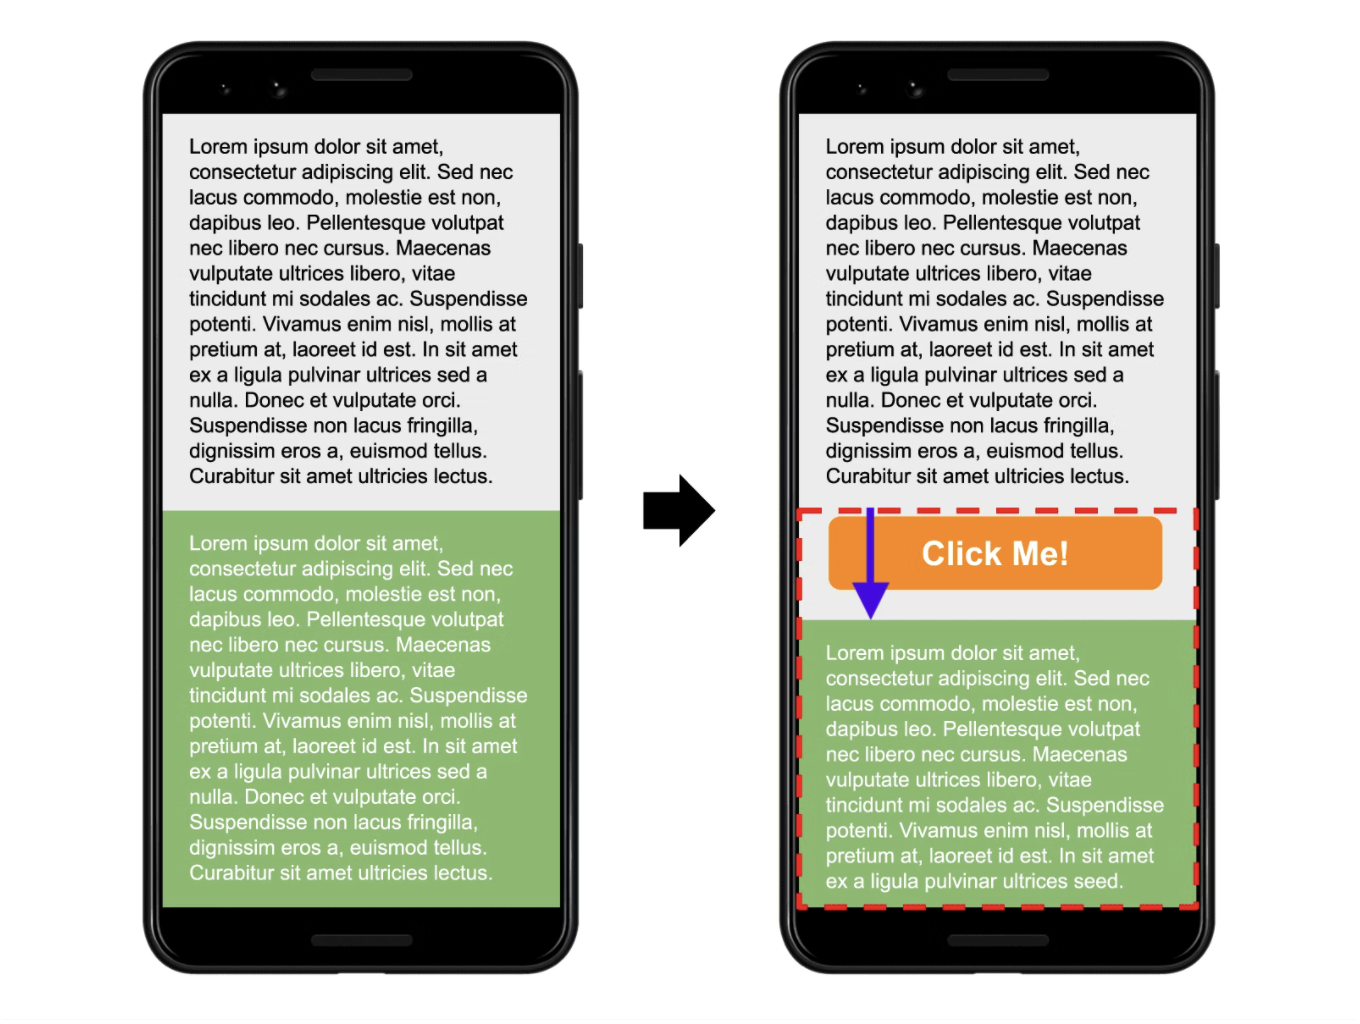
What is Cumulative layout shift (CLS)?
Defined by Google: "Cumulative Layout Shift (CLS) is an important, user-centric metric for measuring visual stability because it helps quantify how often users experience unexpected layout shifts."
Basically, CLS measures how we experience sudden changes in what we see displayed on a page. While some changing imagery can be intentional and drive engagement (gifs, slideshow banners, etc.), other unintended changes such as sudden format or location changes for text boxes, images, or links can be jarring – and irritating - for a user.
Let us take moving buttons as an example. If a user goes to click a button hoping to be redirected to one page, but the button moves and the user ends up clicking on another button and in turn is redirected to a completely different – and undesired – page, this does not provide a great customer experience.
To aim for a good user experience, a CLS score should have a raiting of 0.1 or under. If the CLS score does not fall in this range, it is either a score that needs improvement (between 0.1 and .25) or a poor score (anything over 0.25).
Now with an overview of what PageSpeed Inisghts is, you might wonder who should use this tool.
Who should use PageSpeed Insights?
PageSpeed Insights can be used by developers and non-developers alike as it provides information on page performance in both a controlled environment (lab data) and in a real-world setting (field data). However, it is an especially valuable tool for non-developers, as they might not have access to their own real-life field data for the website and can then have this real-world performance data on specific pages of the site. Developers, on the other hand, would have access to this performance data in the field, and may choose to use Lighthouse instead.
However, before we address Google Lighthouse, we will first look at Core Web Vitals.
Core Web Vitals
What are Core Web Vitals?
The metrics that comprise Core Web Vitals are expected by Google to “evolve over time. The current set for 2020 focuses on three aspects of the user experience—loading, interactivity, and visual stability.”
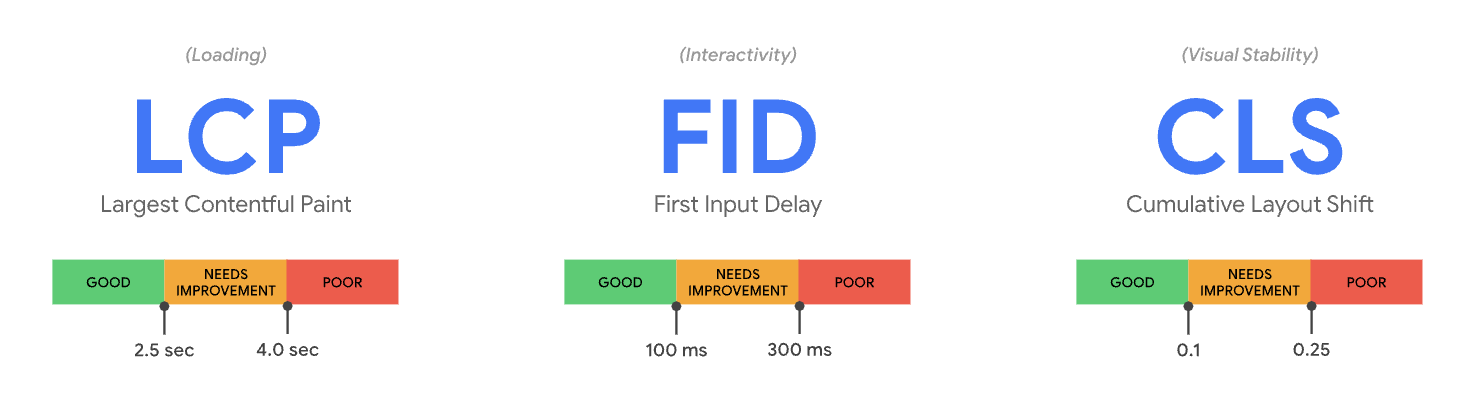
If you read all about PageSpeed Insights in the previous section, then the terms loading, interactivity and visual stability might sound familiar to you. That is because the three Core Web Vitals metrics (Largest Contentful Paint (LCP), First Input Delay (FID), and Cumulative Layout Shift (CLS)) are some of the same metrics included in PageSpeed Insights – only First Contentful Paint (FCP) is excluded.
Google Lighthouse
What is Google Lighthouse?
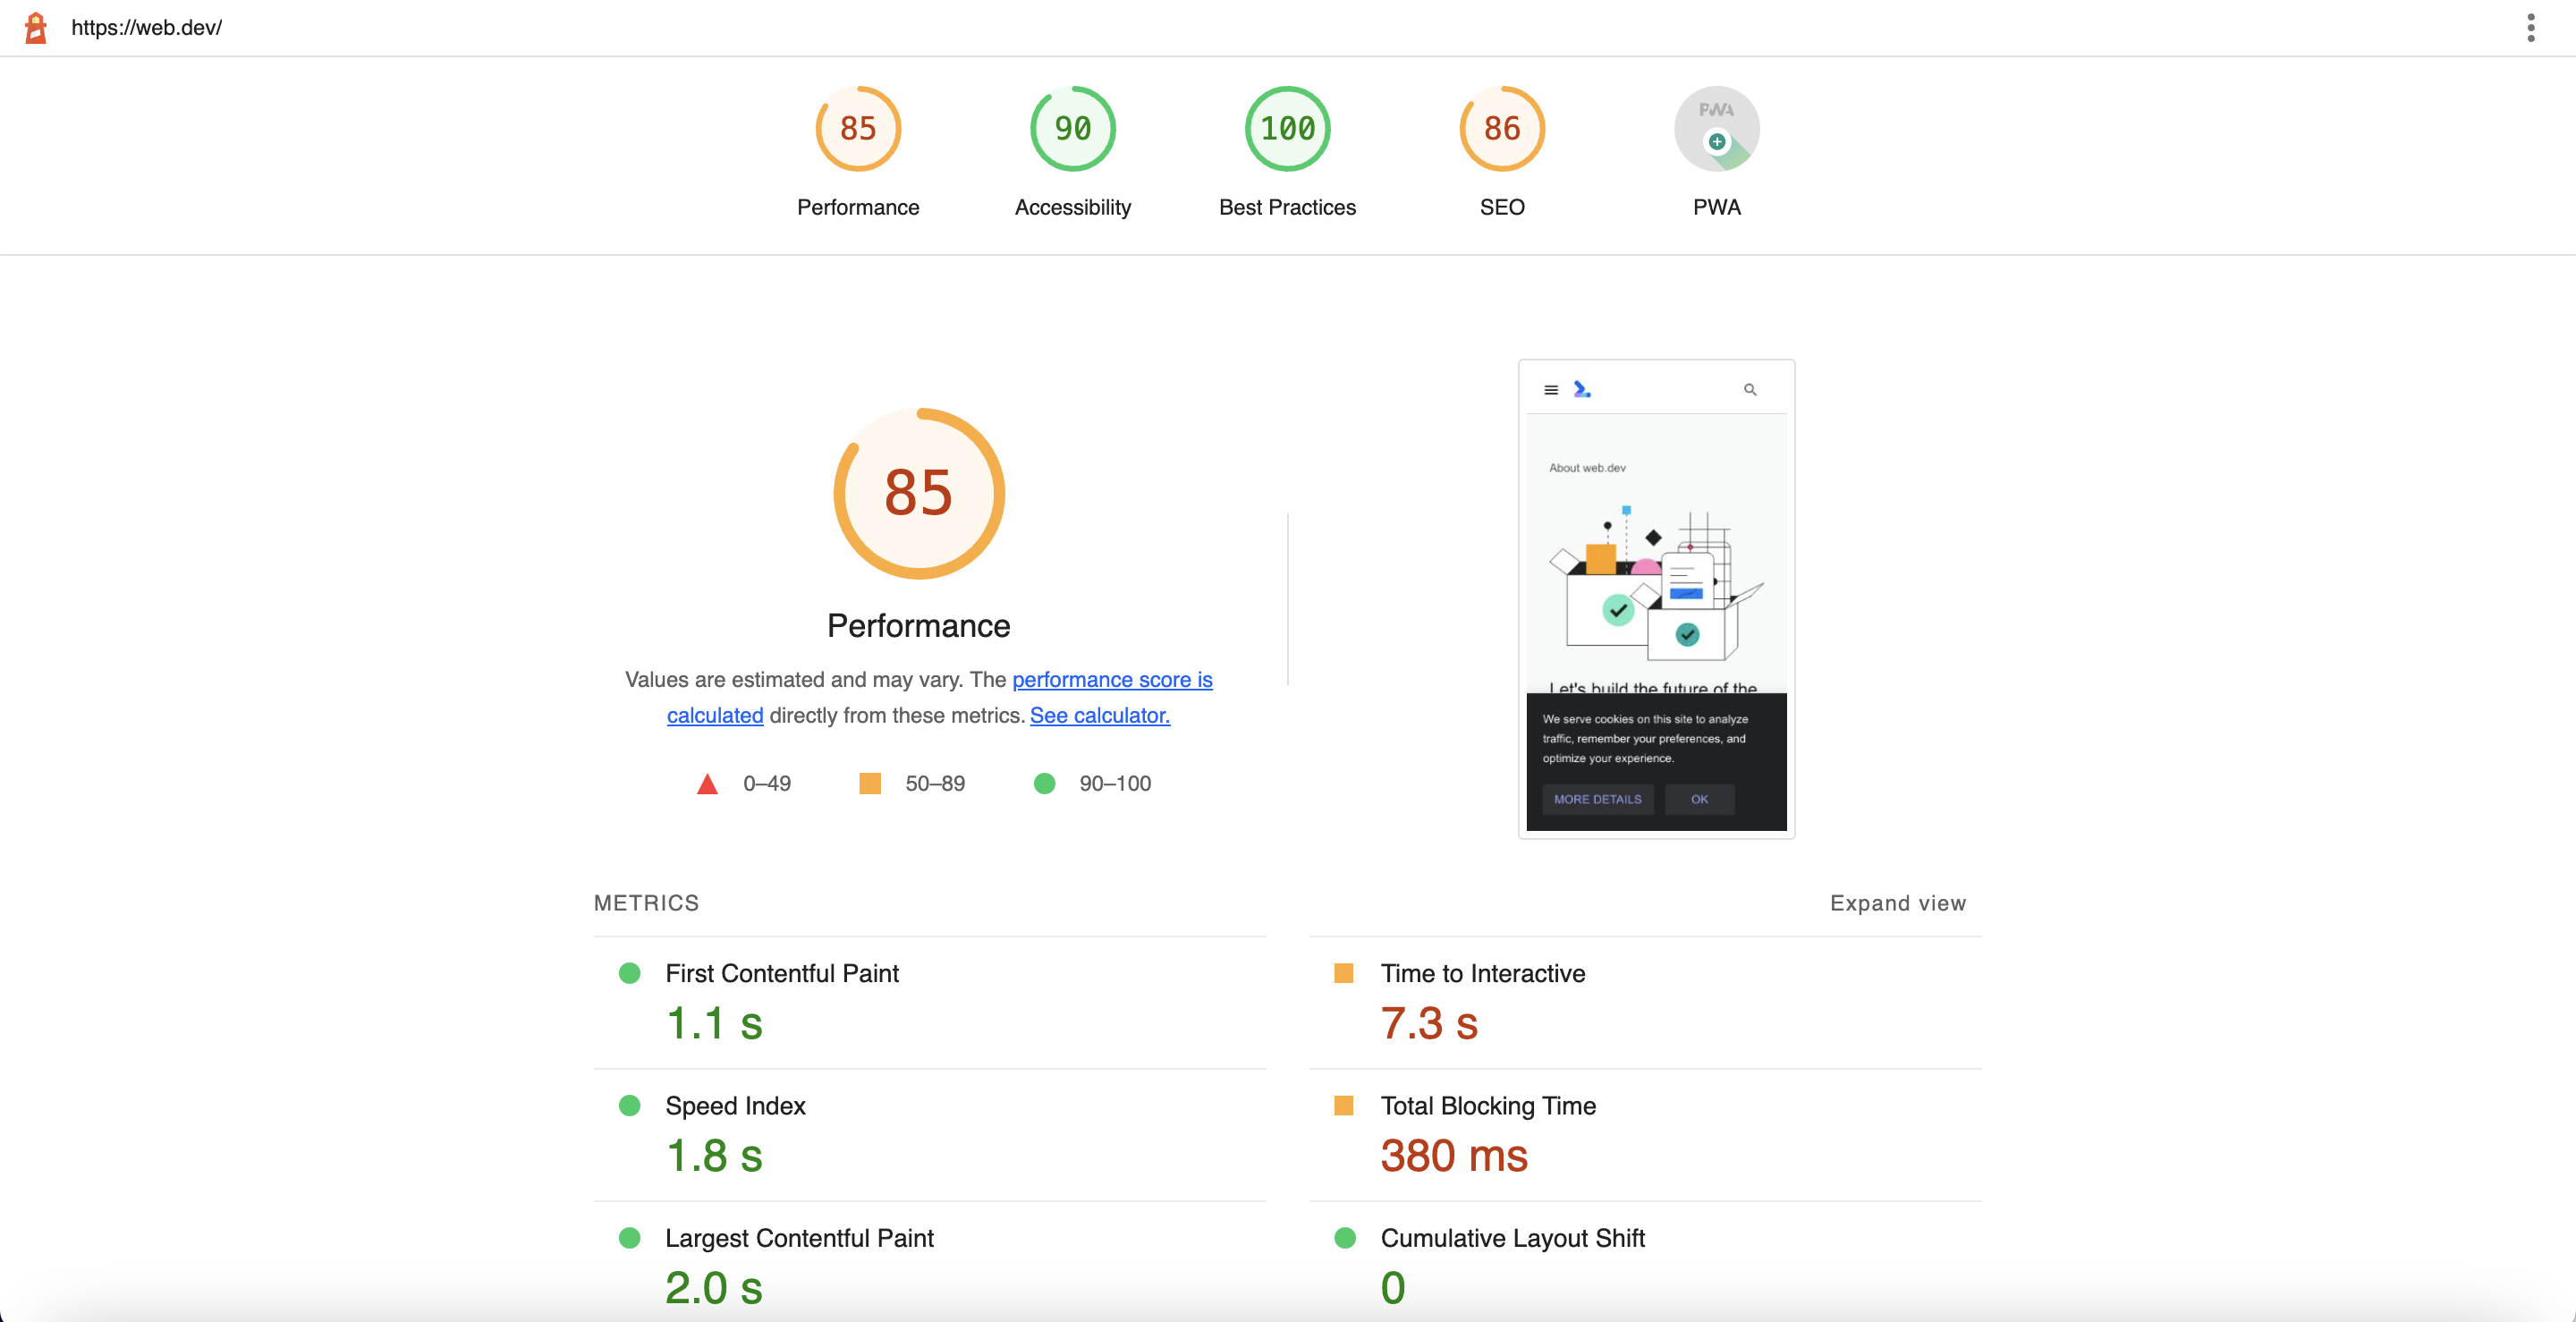
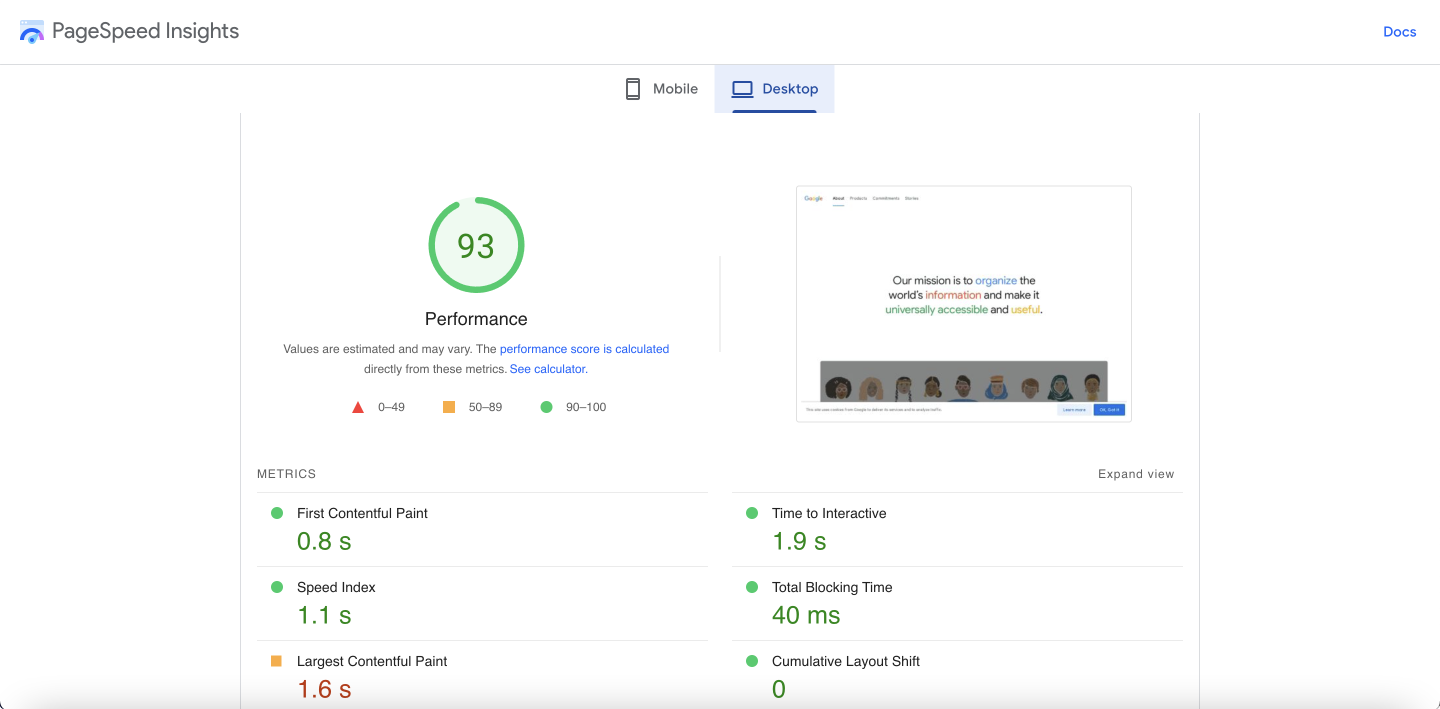
Lighthouse reports are generated in a controlled environment (lab data) and provide information on the quality of webpages in regards to five factors:
Performance, accessibility, best practices, SEO and PWA.
The performance score provided in the Lighthouse report is a weighted average of 6 different metric scores – all measuring some form of page load speed:
• First Contentful Paint (FCP) - 10%
• Largest Contentful Paint (LCP) - 25%
• Cumulative Layout Shift (CLS) - 15%
• Speed Index – 10%
• Time to Interactive (TTI) - 10%
• Total Blocking Time (TBT) - 30%
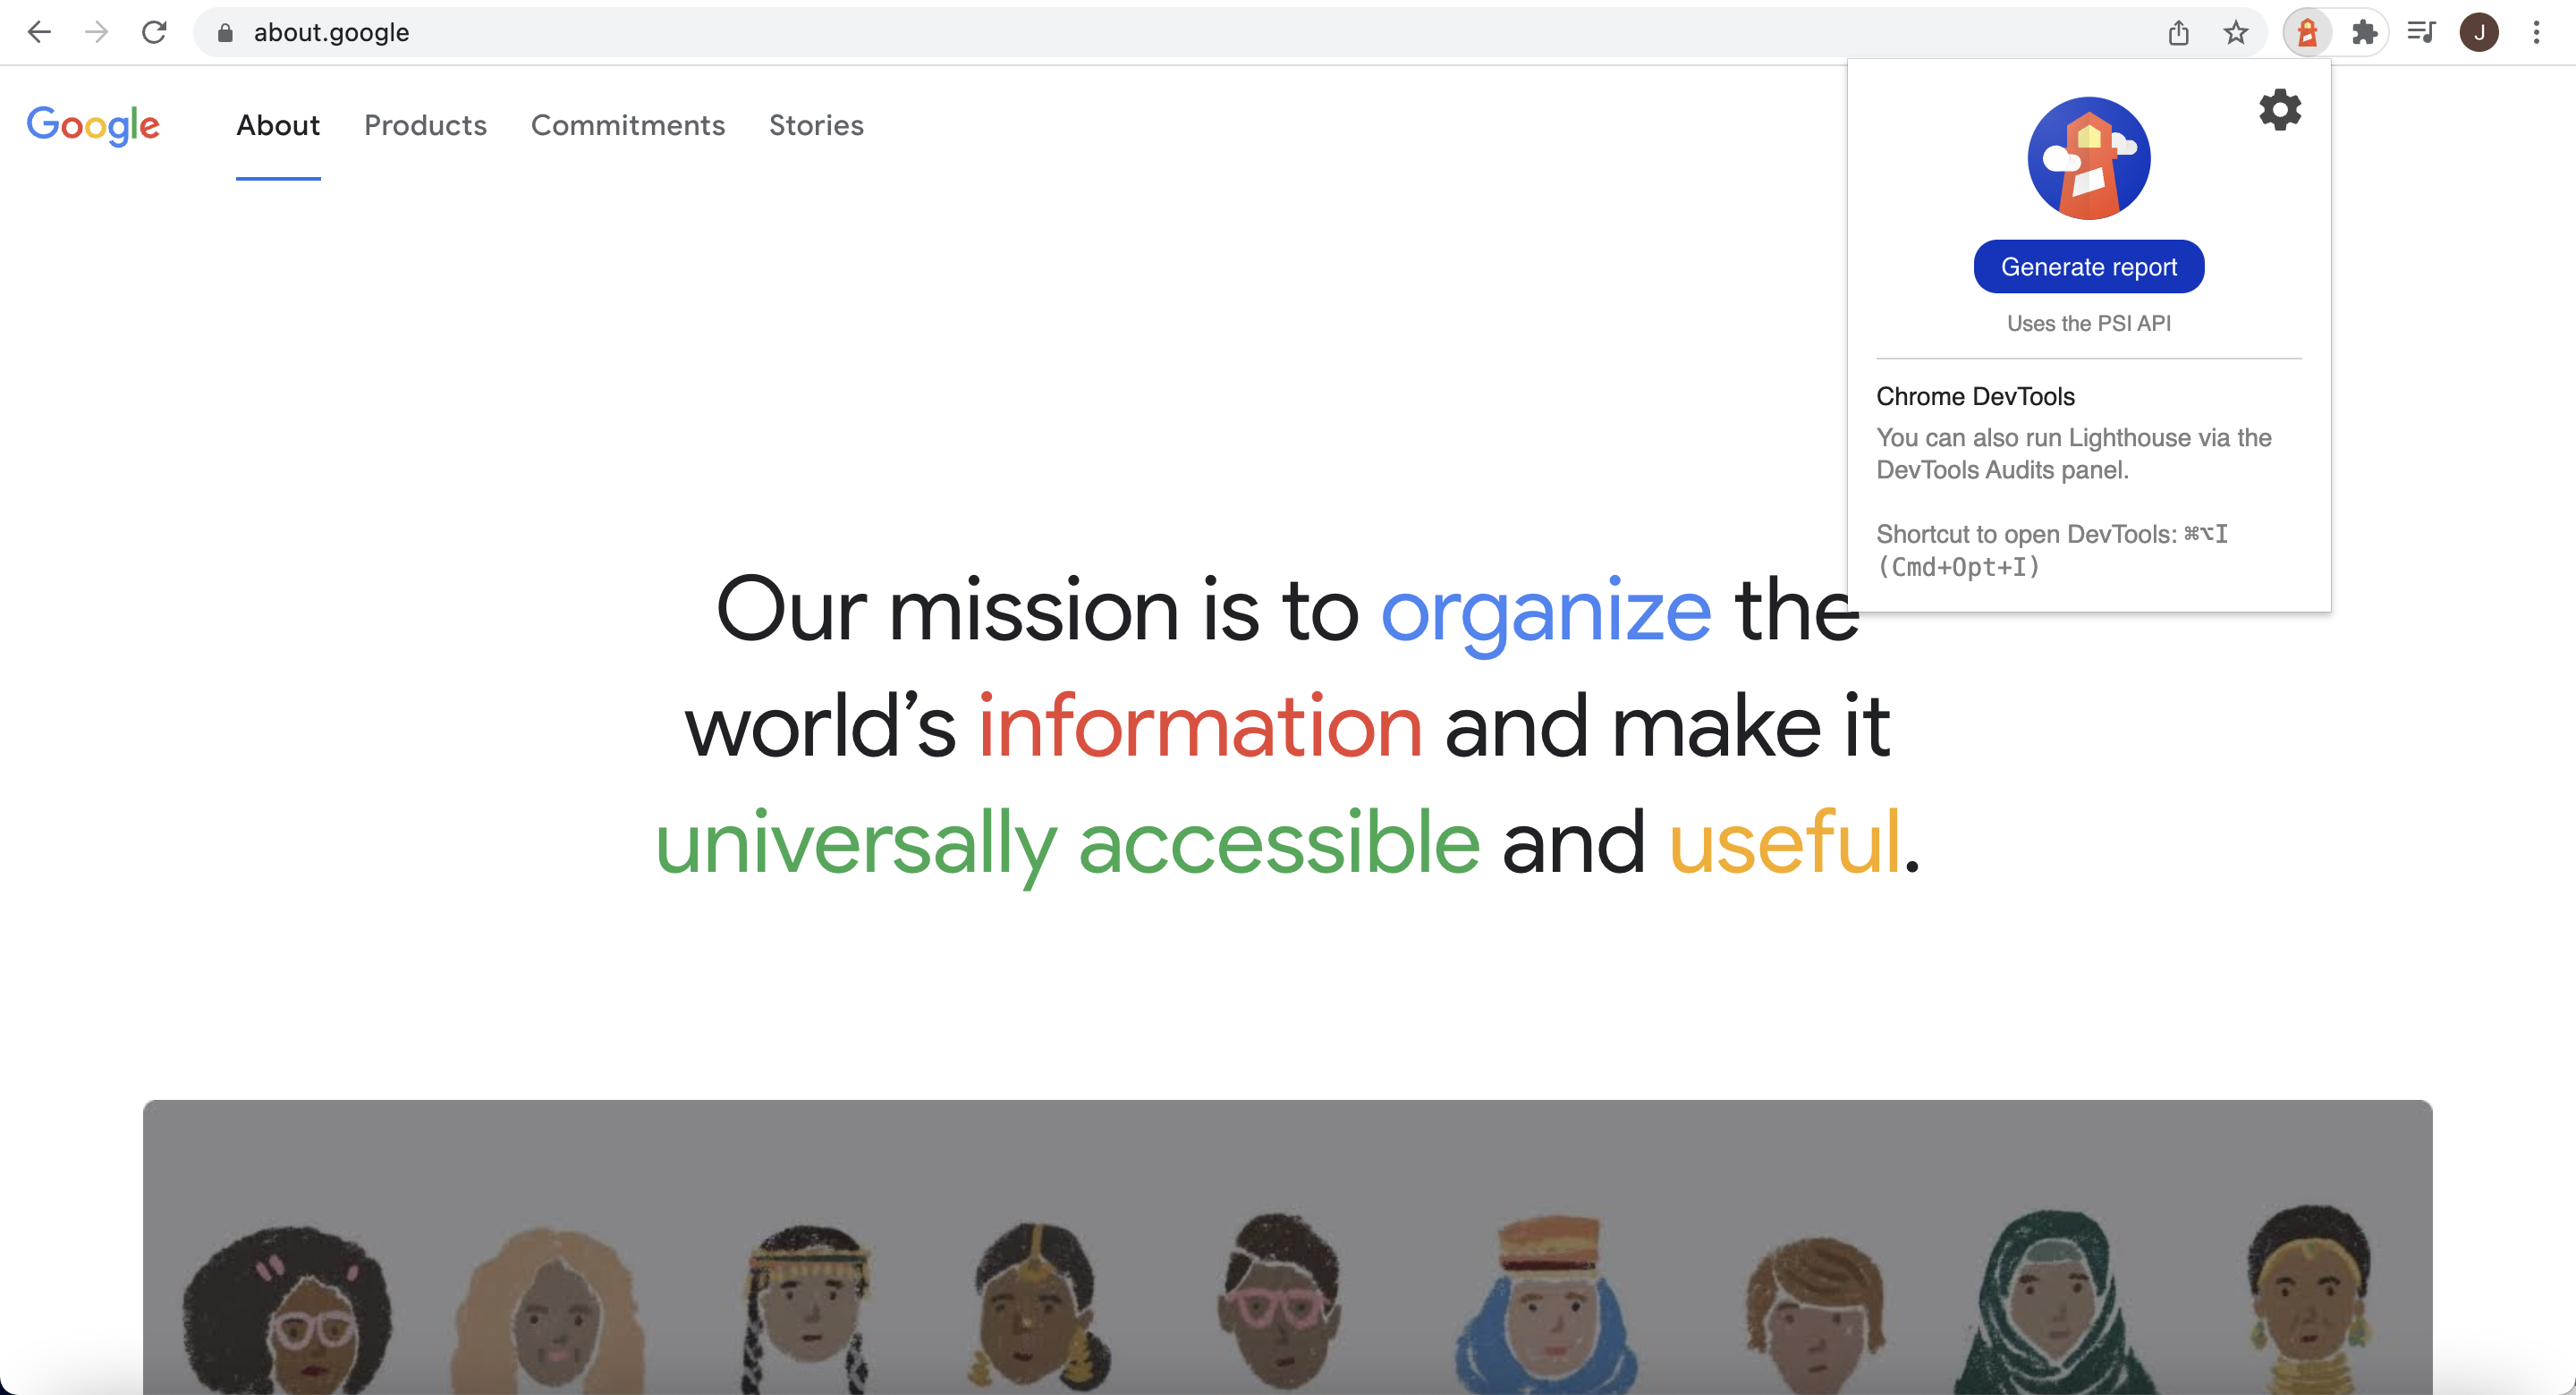
Google adds that the metric scores are not visible in the report, but are calculated under the hood. While you can access Lighthouse a variety of different ways, one easy way is to add the Lighthouse chrome extension, so you can quickly click Generate report to get insights on your site.
If you have read about PageSpeed Insights and Core Web Vitals in the previous sections, then FCP, LCP and CLS should sound familiar, but let us give a brief recap:
First Contentful Paint (FCP)
This measures the time that has passed from when a webpage starts to load to when part of a webpage’s contents (text, images, etc.) has been rendered on the screen.
Largest Contentful Paint (LCP)
This measures the time that has passed from when a webpage starts to load to when the largest content block (text, images, etc.) visible within the viewport has been rendered.
Cumulative Layout Shift (CLS)
This measures how users experience sudden changes and unexpected movements in what is displayed on a page – often due to resources loading asynchronously.
Now, let us review the three other metrics included in determining the performance score.
What is Speed Index?
According to Google, "Speed Index measures how quickly content is visually displayed during page load. A green (fast) Speed Index score is 3.4 seconds or under, an orange (moderate) score is between 3.4 seconds and 5.8 seconds, and a red (slow) score is anything over 5.8 seconds."
What is Time to Interactive (TTI)?
As defined by Google, "TTI measures how long it takes a page to become fully interactive. A page is considered fully interactive when:
• The page displays useful content, which is measured by the First Contentful Paint,
• Event handlers are registered for most visible page elements, and
• The page responds to user interactions within 50 milliseconds."
A green (fast) TTI score is 3.8 seconds or under, an orange (moderate) score is between 3.9 seconds and 7.3 seconds, and a red (slow) score is anything over 7.3 seconds.
As these points indicate, there is a relationship between content visibility (FCP), interactivity and responsiveness (FID), and full interactivity (TTI). According to Google, "measuring TTI is important because some sites optimize content visibility at the expense of interactivity".
What is Total Blocking Time (TBT)?
As defined by Google, "TBT measures the total amount of time that a page is blocked from responding to user input, such as mouse clicks, screen taps, or keyboard presses. The sum is calculated by adding the blocking portion of all long tasks between First Contentful Paint and Time to Interactive."
Again, this shows the close relationship between these different page speed metrics.
A green (fast) TBT score is 200 ms or under, an orange (moderate) score is between 200 ms and 600 ms, and a red (slow) score is anything over 600 ms.
Now with an overview of what Lighthouse is and measures, you might wonder who should use this tool.
Who should use Lighthouse?
Lighthouse is best suited for developers, as the simulated, or controlled, environment allows for the possibility to find opportunities for performance improvements during development.
How are PageSpeed Insights, Core Web Vitals and Lighthouse connected?
For many who are unfamiliar with PageSpeed Insights, Core Web Vitals and Google Lighthouse, they often search for how these terms and tools are different. It is, of course, important to understand the differences, but also in how these terms and tools are connected.
PageSpeed Insights provides both simulated (lab) data and historical real-world (field) data about a webpage and reports the mobile and desktop performance based on four metrics: FCP, LCP, FID and CLS.
Core Web Vitals reports on three metrics: LCP, FID, and CLS.
Lighthouse provides simulated (lab) data and uses FCP, LCP and FID as three of the six metrics to determine the performance score, as well as reporting on other factors of webpage quality including PWA, best practices, SEO and accessibility.
PageSpeed Insights uses Lighthouse to collect simulated (lab) data and to generate a website performance score from a given URL.
Also included in the PageSpeed report is a Core Web Vitals assessment right at the top of the report for both desktop and mobile.
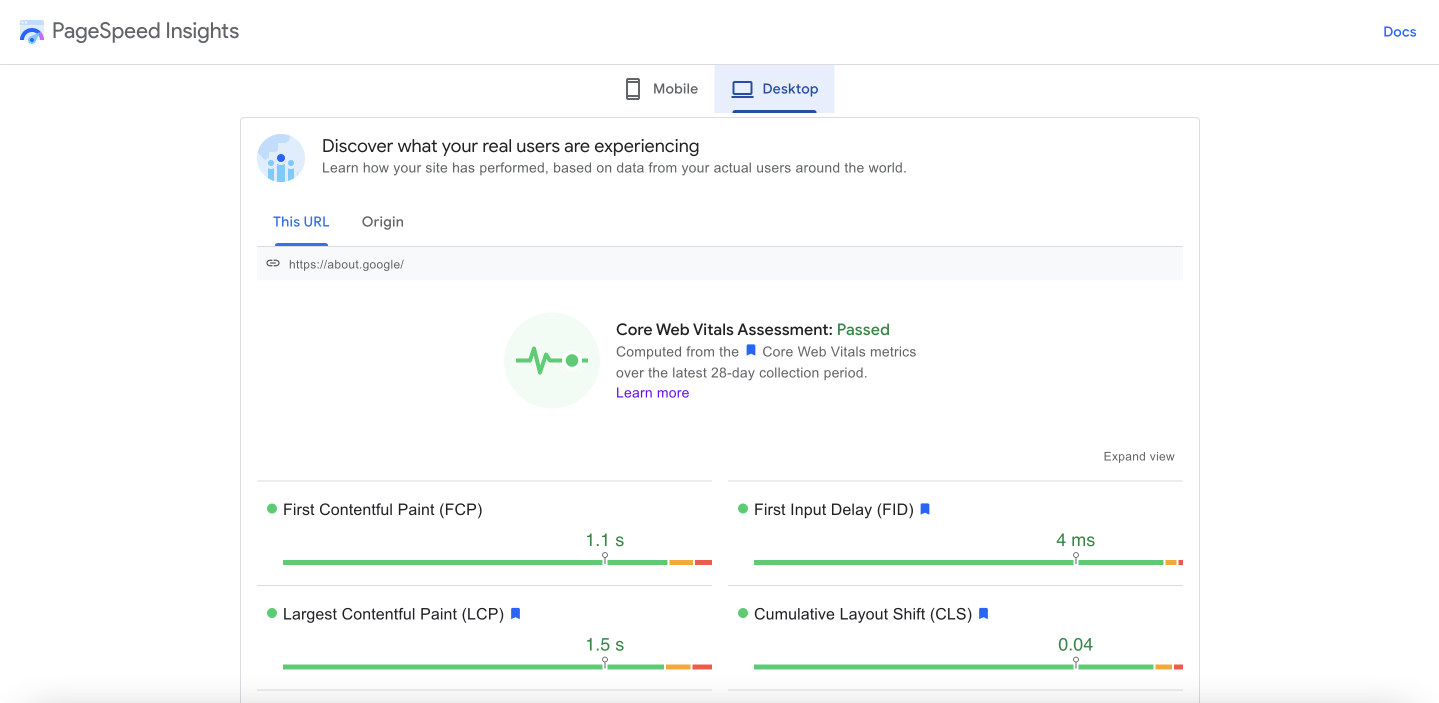
While you can use PSI to review your Core Web Vitals, you can also use tools such as Google Search Console, Web Vitals chrome extension and ChromeDev Tools to assess a page’s core web vitals.
Whether it is best to use PageSpeed Insights or Lighthouse, or review the Core Web Vitals via other tools ultimately comes down to your role, the insights you are interested in learning about, and which aspects of the website you are interested in improving.
Improving webpage load speed
As we mentioned at the beginning, there are many factors that impact how well a website performs and converts - yet page speed influences influences many of these other important factors, including user experience, bounce rate, return on investment, SEO and SERP.
Now that you know what these terms and tools are, and the importance of page speed, you can start to look at how to improve webpage load speed. We have already compiled a list of three tips here.
You can also get a head start by providing your SME customers with a conversion-friendly website designed for visitors to quickly find and visit. Mono Websites offers SEO-optimized templates and quick load speed, as Mono templates are consistently scoring in the 90th percentile on all parameters in the Google Lighthouse report.
About Mono
Mono is founded on the belief that all small businesses deserve the same level of online presence and performance as larger companies. With Mono platforms and products, we want to provide small businesses an all-in-one solution to boost their online presence and sell more. We not only want to provide the digital tools to fulfill their digital presence needs, but we also want to share inspiration for small business owners and web designers for their digital journey.